Marina Occupancy Forecasting: Tools & Strategies for Seasonal Demand
Marina managers across the Mediterranean, Caribbean, and Pacific face an uncomfortable reality every year: summer berths sell out weeks in advance while shoulder-season slips sit empty, generating zero revenue. In peak months, you turn away high-value superyachts. In low months, fixed costs—harbour staff, utilities, maintenance contracts, insurance—continue to drain the budget. The financial swing between a fully occupied 300-berth marina in August and the same facility at 40% occupancy in November can easily exceed €500,000 in lost revenue per season.
Yet most marina operators still rely on little more than last year's booking spreadsheet and gut instinct to manage this challenge. Marina occupancy forecasting changes that equation entirely. By combining historical booking data, seasonal demand patterns, weather analytics, and event-driven intelligence, modern forecasting tools allow marina managers to predict demand weeks or months in advance—and to price, market, and allocate capacity accordingly.
This guide walks through the core strategies, data inputs, and software capabilities that transform reactive marina management into a proactive, revenue-optimised operation.
Understanding Seasonal Demand Patterns in Marina Management
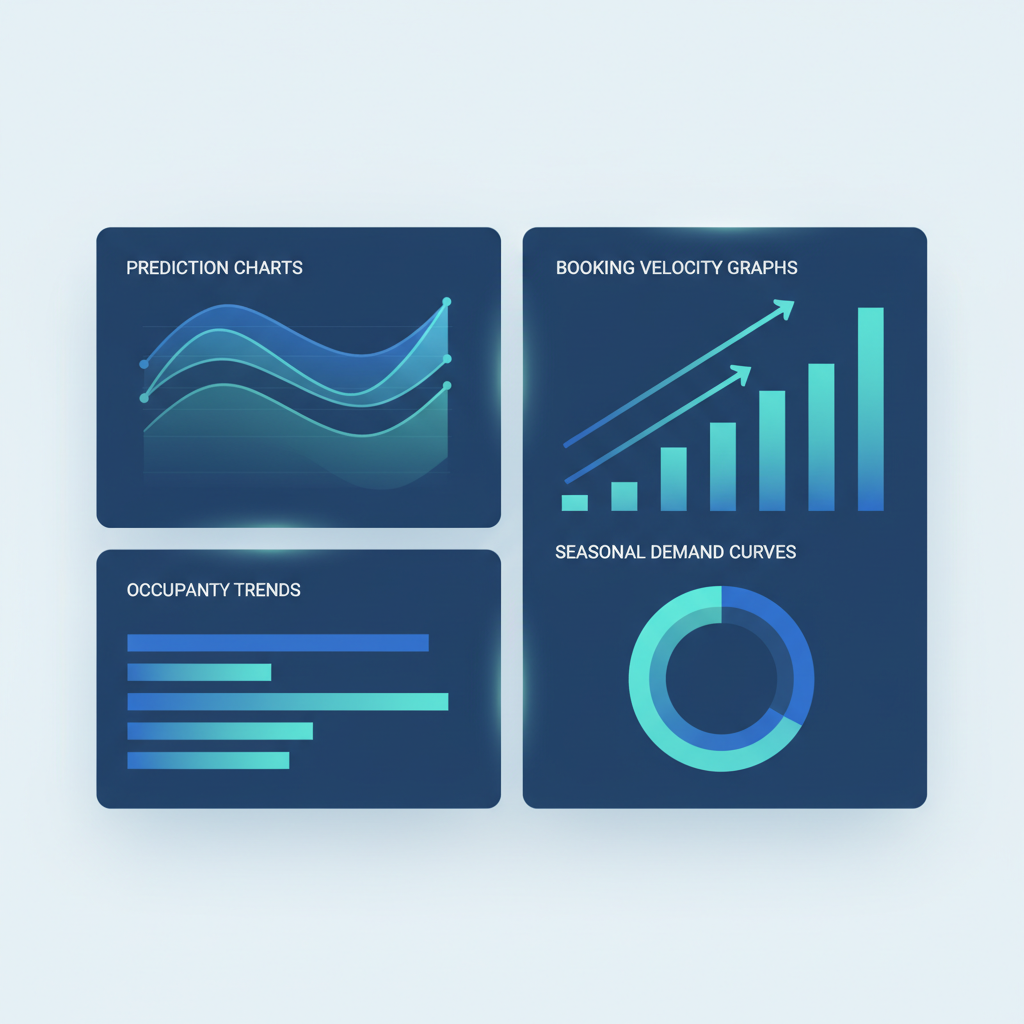
Before any forecasting model can be built, operators need to understand the structural demand patterns that repeat every year. Seasonal demand in marinas is driven by a predictable combination of factors: school holidays, regattas and sailing events, weather windows, and the migration patterns of charter fleets and private owners.
In the Mediterranean, for example, a typical demand curve peaks sharply in July and August, with a secondary shoulder season in June and September. October through April sees dramatically reduced occupancy, though liveaboards and long-term tenants provide a stable base. Understanding where your marina sits within this curve—and how it deviates from the regional average—is the foundation of effective forecasting.
Identifying Your Baseline Occupancy Profile
To establish a reliable baseline, marina management teams should analyse at least three to five years of historical booking data across several dimensions:
- Berth-type occupancy rates: Large superyacht berths, medium sailing yacht slips, and small powerboat spaces each follow distinct demand curves
- Length-of-stay distributions: Are bookings predominantly overnight transient visits, weekly stays, or monthly long-term contracts?
- Lead time patterns: How far in advance do peak-season bookings arrive versus shoulder-season ones?
- Nationality and origin analysis: Which charter bases, yacht clubs, or flag registries generate your peak-season visitors?
- Cancellation rates by season: Understanding which segments cancel most frequently helps refine net occupancy projections
This baseline analysis reveals not just when demand peaks and troughs, but why—and that distinction is critical for building actionable forecasting models.
Differentiating Transient, Seasonal, and Annual Berth Holders
A common mistake in marina occupancy analysis is treating all berths as a single pool. In reality, most marinas operate with a layered occupancy structure. Annual berth holders provide predictable revenue regardless of season but reduce the transient berths available for dynamic pricing. Seasonal contracts—common for charter fleets operating May through October—create mid-term certainty. Transient bookings are where dynamic pricing has the greatest impact, but they are also the most volatile and hardest to forecast.
Effective forecasting models must account for each layer separately, then aggregate to produce a true picture of available capacity and expected revenue at any given point in the season.
Historical Data Analysis: The Foundation of Marina Occupancy Forecasting
Accurate marina occupancy forecasting requires clean, structured historical data. Many marinas discover at this stage that their records are fragmented across paper logs, basic spreadsheets, and disconnected booking systems—making meaningful analysis nearly impossible without significant data cleansing work.
The minimum dataset for a reliable forecasting model includes:
- Daily berth occupancy records by berth category and size class, ideally going back five or more years
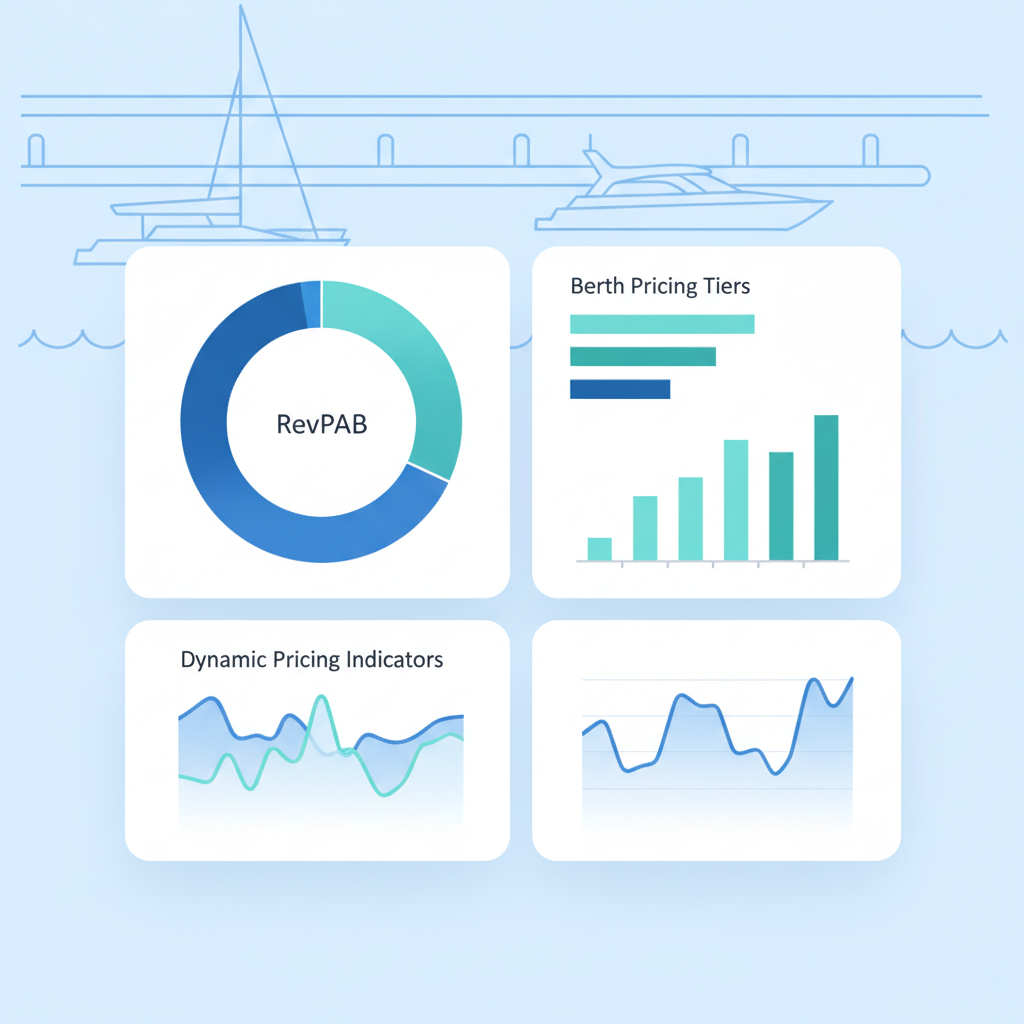
- Revenue per available berth (RevPAB) by month and quarter
- Booking channel data—direct telephone, online booking platforms, VHF walk-ins, broker referrals
- Length-of-stay and turnover rates by berth type
- Historical weather data aligned with booking patterns (departures, no-shows, early arrivals)
- Local event calendars—regattas, boat shows, festivals, school holidays
Once this data is consolidated into a single system, statistical analysis can identify year-on-year trends, detect anomalies (such as the COVID-19 dip or an unusually stormy summer), and build regression models that project future occupancy from leading indicators.

Dynamic Pricing Strategies for Marina Revenue Management
Hotel and airline industries have used dynamic pricing for decades. Marinas are only now catching up, and the revenue uplift potential is substantial. Dynamic pricing in marina management means adjusting berth rates in real time—or at least week by week—based on current demand signals, remaining capacity, and lead time to arrival.
Rate Bands and Capacity Triggers
The simplest dynamic pricing approach uses capacity-based rate bands. When occupancy projections for a given week fall below 40%, early-bird discounts activate to stimulate demand. Between 40% and 70%, standard rates apply. Above 70%, premium rates are automatically applied—capturing additional margin from the most desirable dates without any manual intervention from marina staff.
More sophisticated models incorporate additional variables:
- Vessel size premium: Superyachts over 30 metres command premium rates year-round due to limited availability of deep-draft berths
- Lead-time pricing: Bookings made more than 60 days in advance receive moderate discounts; last-minute bookings within seven days of arrival are priced at a premium reflecting their high value to operators with space
- Duration incentives: Stays of seven or more nights receive 10–15% discounts, incentivising longer occupancy and reducing operational turnover costs
- Competitor benchmarking: Rate monitoring of nearby marinas ensures your pricing remains competitive without unnecessarily underselling capacity
Yield Management Metrics That Matter
Effective revenue management requires tracking the right metrics. Beyond simple occupancy percentage, marina managers should monitor:
- Revenue per available berth-night (RevPABN): The marina equivalent of hotel RevPAR, combining occupancy and average rate into a single performance indicator
- Contribution margin by berth category: Large berths carry higher utility and maintenance costs; contribution margin analysis ensures premium pricing reflects true profitability
- Booking pace: How current booking accumulation for a future date compares to the same point last year—a critical leading indicator of whether to apply promotional rates or hold pricing
Weather Impact Analysis in Demand Forecasting
Weather is the single most powerful exogenous variable affecting marina occupancy. Summer storms delay arrivals, extend stays unexpectedly, and cause last-minute cancellations. Persistent fog in autumn drives charter fleets back to base weeks earlier than planned. A well-designed forecasting model integrates meteorological data to refine demand projections and flag operational risks.
Key weather-demand correlations worth modelling include:
- Wind strength and direction relative to approach channels—strong onshore winds generate significantly higher walk-in transient demand as vessels seek shelter
- Extended good-weather windows that extend shoulder seasons by two to four weeks, as evidenced in recent Mediterranean seasons
- Storm event impacts on occupancy: typically a 48–72 hour surge in emergency berth requests followed by an extended occupancy tail as vessels await weather improvements
Modern forecasting platforms can integrate API feeds from meteorological services—Copernicus Marine Service, Windy, or national weather authorities—to automatically adjust short-term occupancy projections as forecast conditions evolve.
Event-Driven Demand: Regattas, Boat Shows, and Local Festivals
For marinas well-positioned relative to major sailing events, the regatta calendar is the most predictable demand driver in the year. The Rolex Middle Sea Race from Malta, the Giraglia Rolex Cup around Corsica and Sardinia, the Cowes Week in the Solent, and dozens of regional regattas each generate concentrated berth demand lasting several days to two weeks around the event period.
Effective demand planning for event-driven periods requires:
- Maintaining a multi-year event calendar integrated into the forecasting system
- Analysing historical data to quantify the typical occupancy uplift per event (many major regattas generate 95–100% occupancy across the host marina and several nearby facilities)
- Implementing dedicated allocation blocks for event participants, with separate pricing tiers for race fleet versus spectator vessels
- Coordinating with event organisers 12–18 months in advance to secure official berth provider status, which triggers significant booking volume
Beyond sailing events, local tourism festivals, public holidays, and regional boat shows create secondary demand spikes worth capturing in any seasonal demand model.
Capacity Planning and Infrastructure Optimisation
Forecasting is not purely a revenue tool—it also drives strategic infrastructure decisions. When long-term data shows a structural shift in vessel size mix (a trend clearly visible across Mediterranean marinas over the past decade, as average yacht lengths increase), capacity planning analysis can justify investment in reconfiguring berths or deepening channels.
Similarly, forecasting models that project persistent shoulder-season underutilisation might support the business case for alternative revenue programmes during low-occupancy periods: dry storage contracts, boat show venue rental, liveaboard community development, or marine services tenanting.
Multi-year demand forecasting should inform:
- Pontoon and berth configuration reviews every three to five years
- Shore power and water infrastructure investment prioritisation
- Staff hiring plans aligned with projected peak periods
- Fuel dock and boatyard capacity planning
The ROI of Marina Occupancy Forecasting Tools
The financial case for investing in proper forecasting infrastructure is compelling. Marinas that have implemented structured revenue management programmes report consistent and measurable improvements:
- 8–18% increase in annual berth revenue through dynamic pricing alone, without adding a single berth
- 15–25% improvement in shoulder-season occupancy through targeted early-bird pricing and proactive marketing campaigns triggered by below-pace bookings
- Reduction in emergency and ad-hoc pricing decisions that previously left significant revenue on the table during peak demand periods
- Improved staff efficiency as automated forecasting alerts replace manual occupancy monitoring, freeing marina staff to focus on guest experience
- Better capital allocation decisions supported by multi-year demand data rather than subjective management estimates
For a 200-berth marina with average annual revenue of €1.5 million, even a conservative 10% revenue improvement through better forecasting and pricing generates €150,000 in additional income annually—well exceeding the cost of any forecasting software investment.
Frequently Asked Questions
What data do I need to start marina occupancy forecasting?
At minimum, you need three to five years of daily berth occupancy records by berth size and type, historical revenue data, and booking channel information. Enriching this with weather history and event calendars significantly improves forecast accuracy.
How does dynamic pricing work for marina berths?
Dynamic pricing in marinas adjusts berth rates automatically based on real-time occupancy projections. When future occupancy for a given period falls below target thresholds, promotional rates activate. When occupancy approaches capacity, premium rates apply—maximising revenue without any manual intervention.
Can small marinas benefit from occupancy forecasting tools?
Yes. Even marinas with fewer than 100 berths benefit significantly from structured demand analysis. The relative simplicity of smaller operations actually makes forecasting models easier to implement and interpret, and the revenue impact of better pricing decisions is proportionally just as significant as for large facilities.
Getting Started with Professional Marina Forecasting
Transforming your marina from reactive capacity management to data-driven revenue optimisation does not happen overnight, but the pathway is clear. The first step is consolidating your historical booking and revenue data into a single structured format. The second is selecting a platform that provides the forecasting, dynamic pricing, and reporting capabilities your operation requires.
SupaSailing's marina management platform includes integrated occupancy forecasting, revenue analytics, and dynamic pricing tools designed specifically for the maritime environment. Whether you operate a 50-berth yacht club or a 500-berth commercial marina, the platform scales to your needs—and the revenue impact is measurable from the first season.
Contact SupaSailing today to schedule a demonstration and discover how much additional revenue your marina is leaving on the table each year.
See SupaSailing in action
Book a free demo call and discover how one platform can run your charter, marina, fleet, shipyard or brokerage.
Book a Free DemoShare this article